Fig. 3
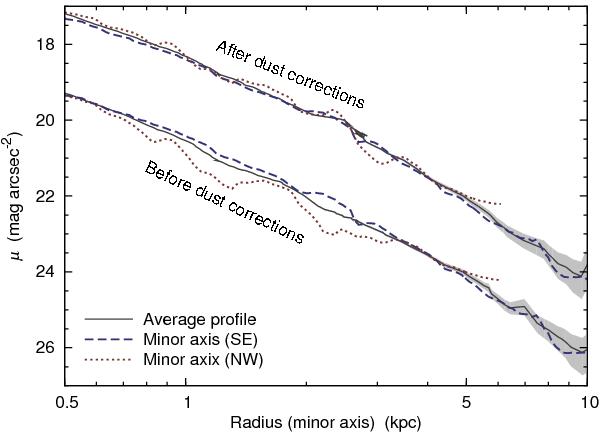
Surface brightness profiles along the minor axis before and after intrinsic dust corrections. Red dotted line shows the profile along the nearer side (NW direction); blue dashed line shows the profile along the further side (SE direction). The corresponding elliptically averaged surface brightness profiles are also shown (black solid lines) together with error estimates (grey region). For clarity, the dust-corrected profiles have been shifted up by two units.
Current usage metrics show cumulative count of Article Views (full-text article views including HTML views, PDF and ePub downloads, according to the available data) and Abstracts Views on Vision4Press platform.
Data correspond to usage on the plateform after 2015. The current usage metrics is available 48-96 hours after online publication and is updated daily on week days.
Initial download of the metrics may take a while.