Fig. 3
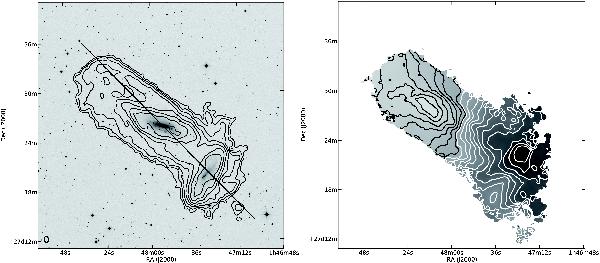
Overview of the HALOGAS observations of NGC 672. The left panel is as in Fig. 1. The contours begin at NH i = 2.5 × 1019 cm-2 and increase by powers of two. The right panel shows the first-moment image derived from the lowest-resolution H i cube. The grayscale ranges from 245 km s-1 (black) to 570 km s-1 (white). Contours are white on the approaching side and black on the receding side, and run from 255 km s-1 to 600 km s-1 in steps of 15 km s-1. The white contour closest to the center of the primary galaxy, corresponding to 425 km s-1, represents the systemic velocity of NGC 672.
Current usage metrics show cumulative count of Article Views (full-text article views including HTML views, PDF and ePub downloads, according to the available data) and Abstracts Views on Vision4Press platform.
Data correspond to usage on the plateform after 2015. The current usage metrics is available 48-96 hours after online publication and is updated daily on week days.
Initial download of the metrics may take a while.