Fig. 1
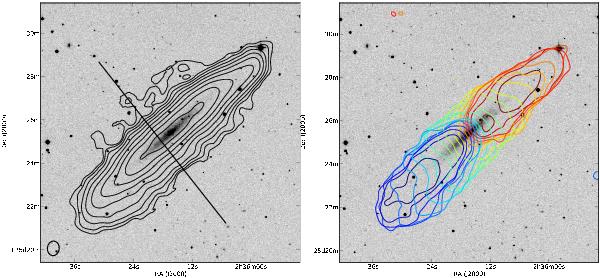
Overview of the HALOGAS observations of UGC 2082. The left panel shows the H i total intensity overlaid on the DSS R-band image. The H i contours originate from the 30″-tapered image, begin at NHI = 1.0 × 1019 cm-2 and increase by powers of two. The straight line shows the orientation of the PV slice shown in Fig. 2. The right panel shows an overlay of several channels in the lowest resolution data cube, all at a level of 0.9 mJy beam-1 (≈3.75σ). The contours are separated by 12.4 km s-1, begin at 593 km s-1 (dark blue) and range upward to 815 km s-1 (dark red). Both panels show the same area of the sky. The beam size of the H i data is shown in the lower left corners of the left panel.
Current usage metrics show cumulative count of Article Views (full-text article views including HTML views, PDF and ePub downloads, according to the available data) and Abstracts Views on Vision4Press platform.
Data correspond to usage on the plateform after 2015. The current usage metrics is available 48-96 hours after online publication and is updated daily on week days.
Initial download of the metrics may take a while.