Fig. 4
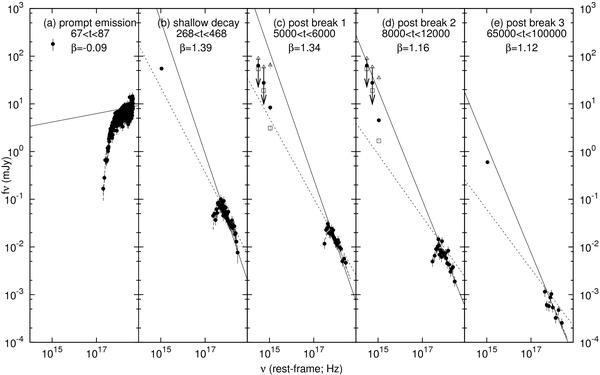
Spectral energy distributions derived for the time intervals of a) 6.7 × 101s < t < 8.7 × 101s, b) 4.3 × 10²s < t < 5.4 × 10²s, c) 5.0 × 10³s < t < 6.0 × 10³s, d) 8.0 × 10³s < t < 1.2 × 10⁴s, and e) 6.5 × 10⁴s < t < 1.0 × 10⁵s. The time intervals of the SEDs for each panel are indicated in figure 2. The abscissa and ordinate denote the rest frame frequency in Hz and the flux density in mJy, respectively. The filled circles are X-ray observations by XRT, optical observations reported to GCN, and our optical-IR observations. The IR observations just provide upper limits of the flux. For the extragalactic extinction, the optical and IR data were corrected with the “Q2” model (Maiolino et al. 2001). The open triangles and squares are data in which their corrections for the extinctions were performed with the Milky Way model and the “Q1” model, respectively (Guidorzi et al. 2007). We omit arrows indicating upper limits of the IR points of the open triangles and squares. The solid lines represent the best-fitted power-law model for the X-ray spectra. The dotted lines are expected spectral slopes from the synchrotron-shock model.
Current usage metrics show cumulative count of Article Views (full-text article views including HTML views, PDF and ePub downloads, according to the available data) and Abstracts Views on Vision4Press platform.
Data correspond to usage on the plateform after 2015. The current usage metrics is available 48-96 hours after online publication and is updated daily on week days.
Initial download of the metrics may take a while.