Fig. 3
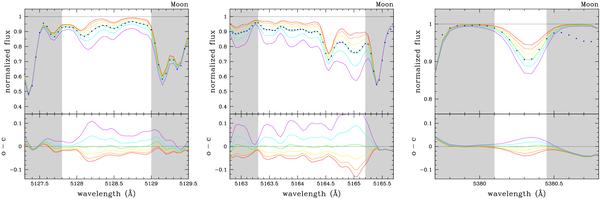
Example to illustrate how the spectral synthesis was applied to the observed data (in this case the spectrum of the sunlight reflected by the Moon). The three regions investigated are shown within the hatched areas: the molecular head bands around λ5128 (left panel) and λ5165 (middle panel), and the C atomic line at λ5380.3 (right panel). Six spectra computed for different values of [C/Fe] and separated by 0.1 dex are shown. The differences between observed and computed spectra (O−C) are also plotted.
Current usage metrics show cumulative count of Article Views (full-text article views including HTML views, PDF and ePub downloads, according to the available data) and Abstracts Views on Vision4Press platform.
Data correspond to usage on the plateform after 2015. The current usage metrics is available 48-96 hours after online publication and is updated daily on week days.
Initial download of the metrics may take a while.