Fig. 1
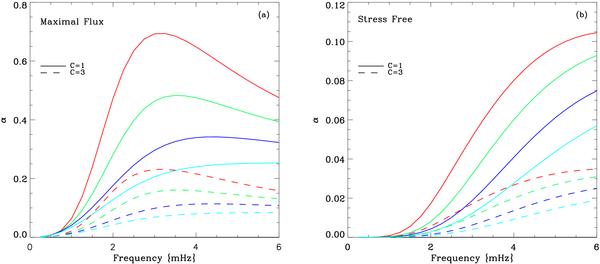
Absorption coefficient calculated as a function of frequency for a simulated plage consisting of a number of flux tubes for two different BC. Each tube is assumed to be of the same β (= 1). Each panel shows the absorption coefficient for two different kernel function. One has much broader wings ( ) than the other (
 ). Each mode order is represented by a different colour: red (p1), green (p2), blue (p3) etc.
Current usage metrics show cumulative count of Article Views (full-text article views including HTML views, PDF and ePub downloads, according to the available data) and Abstracts Views on Vision4Press platform.
Data correspond to usage on the plateform after 2015. The current usage metrics is available 48-96 hours after online publication and is updated daily on week days.
Initial download of the metrics may take a while.