Fig. 2
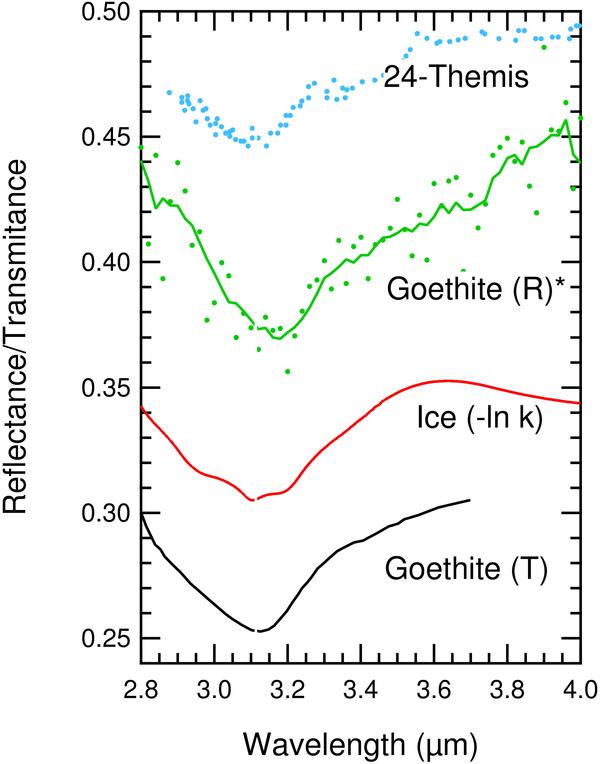
From top to bottom, the 3-μm band in goethite, water ice, and as observed on Themis. The Themis spectrum has been digitized from Rivkin & Emery (2010). The green spectrum is the ratio between the two mixtures with different amounts of goethite, from Fig. 1. The black curve corresponds to the transmission spectrum of synthetic goethite from Ruan et al. (2002), obtained at 110 °C. The red curve shows the imaginary index of the optical constant of water ice (Schmitt et al. 1998) for comparison. Data have been offset and rescaled for clarity.
Current usage metrics show cumulative count of Article Views (full-text article views including HTML views, PDF and ePub downloads, according to the available data) and Abstracts Views on Vision4Press platform.
Data correspond to usage on the plateform after 2015. The current usage metrics is available 48-96 hours after online publication and is updated daily on week days.
Initial download of the metrics may take a while.