Free Access
Fig. 6
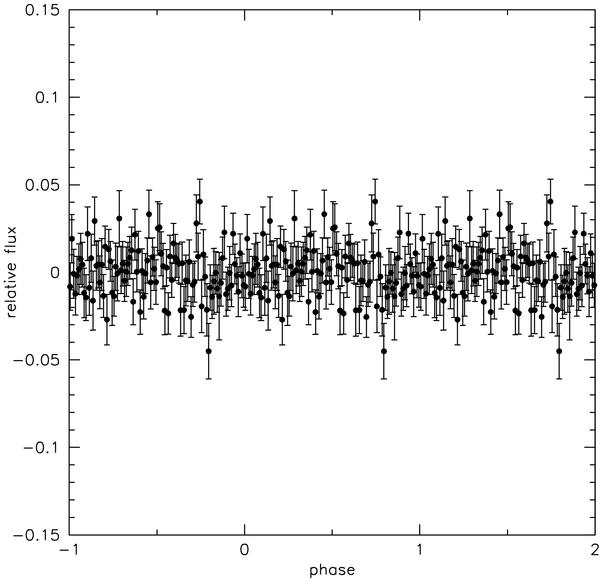
SuperWASP light curve of J1138−0035 folded to the orbital phase. The 11213 data points taken between 2006/07/05 and 2009/07/02 are binned to 100 phase bins. Relative flux is plotted against the orbital phase.
Current usage metrics show cumulative count of Article Views (full-text article views including HTML views, PDF and ePub downloads, according to the available data) and Abstracts Views on Vision4Press platform.
Data correspond to usage on the plateform after 2015. The current usage metrics is available 48-96 hours after online publication and is updated daily on week days.
Initial download of the metrics may take a while.