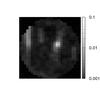
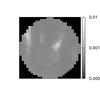
Fig. 5
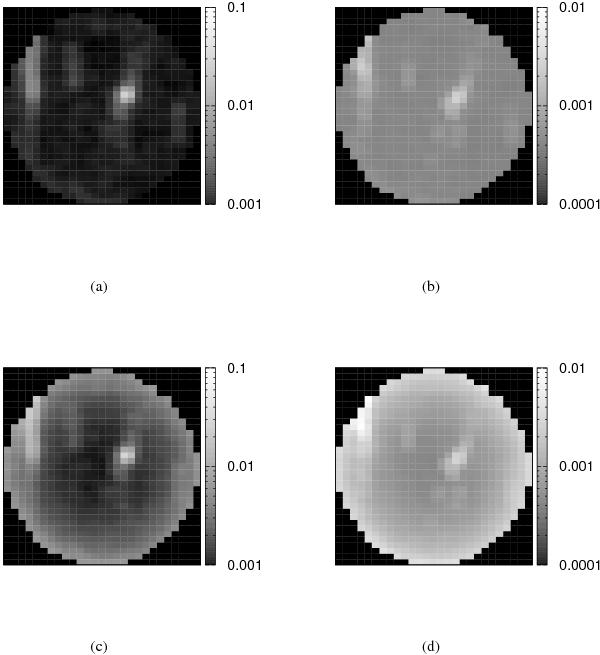
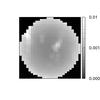
Images representing the entire primary beam. Centred on RA  Dec +29°41′32''̣5. Each pixel represents a field 6.5″ × 5″. The flux density in Jy beam-1 is shown for the brightest pixel in each image and the rms of all of the pixels both with and without primary beam correction applied: a) peak flux density no PB correction; b) rms flux density no PB correction; c) Peak flux density PB correction; d) rms flux density PB correction. The brightest point (towards the top-right) is the A component, attenuated since a simple model of A has been subtracted from the UV data. All flux apart from the brightest pixel in each image is spurious flux from the sidelobes of A or noise.
Current usage metrics show cumulative count of Article Views (full-text article views including HTML views, PDF and ePub downloads, according to the available data) and Abstracts Views on Vision4Press platform.
Data correspond to usage on the plateform after 2015. The current usage metrics is available 48-96 hours after online publication and is updated daily on week days.
Initial download of the metrics may take a while.