Fig. 3
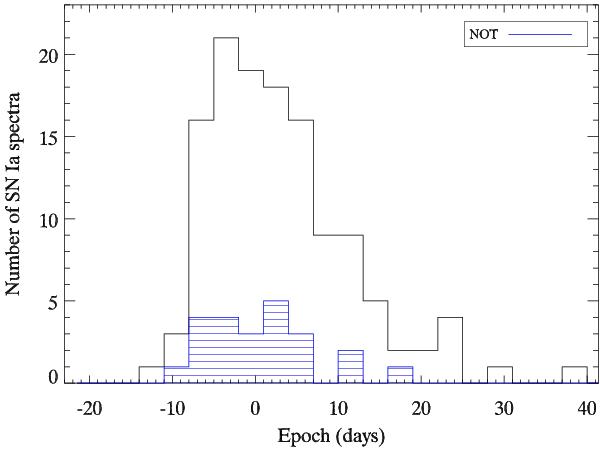
Epoch distribution of the SN Ia spectra observed at the NTT and the NOT, excluding the SNe with poor lightcurves. The un-filled histogram shows the full sample of SN Ia spectra, while the striped histogram shows the subset observed at the NOT. The epoch is defined as the number of days in rest frame since B-band maximum brightness, as obtained from the lightcurve. The 127 spectra are divided into epoch bins with a width of 3 days.
Current usage metrics show cumulative count of Article Views (full-text article views including HTML views, PDF and ePub downloads, according to the available data) and Abstracts Views on Vision4Press platform.
Data correspond to usage on the plateform after 2015. The current usage metrics is available 48-96 hours after online publication and is updated daily on week days.
Initial download of the metrics may take a while.