Fig. 11
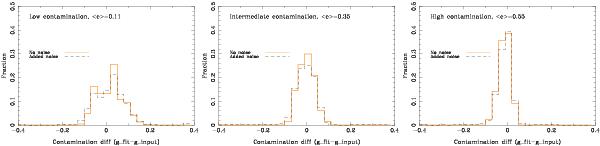
The difference between the g-band host-galaxy contamination that was introduced in the construction of fake spectra (
 ) and the contamination that was obtained during host-galaxy subtraction (
 ) for three different bins in
. The mean contamination for each bin is given in the respective panel as ⟨ c ⟩ . The contamination was calculated as the percentage of the total flux in the observed SDSS g band which comes from the galaxy. The solid histogram corresponds to simulations without added noise while the dashed line corresponds to where noise is added. The dispersion is largest for small input contaminations. The number of outliers increase from 0.9% to 2% when noise is added.
) for three different bins in
. The mean contamination for each bin is given in the respective panel as ⟨ c ⟩ . The contamination was calculated as the percentage of the total flux in the observed SDSS g band which comes from the galaxy. The solid histogram corresponds to simulations without added noise while the dashed line corresponds to where noise is added. The dispersion is largest for small input contaminations. The number of outliers increase from 0.9% to 2% when noise is added.
Current usage metrics show cumulative count of Article Views (full-text article views including HTML views, PDF and ePub downloads, according to the available data) and Abstracts Views on Vision4Press platform.
Data correspond to usage on the plateform after 2015. The current usage metrics is available 48-96 hours after online publication and is updated daily on week days.
Initial download of the metrics may take a while.