Fig. 10
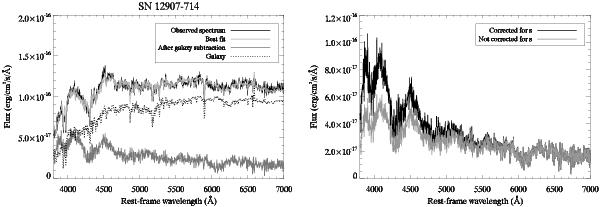
The PCA-based host-galaxy subtraction for the highly contaminated ID 12907 (SN 2006fv) at z = 0.132. Left panel: the observed spectrum (black) is plotted together with the best fit (light grey). The galaxy template of the best fit is shown as a dotted line. The grey line shows the SN spectrum after subtraction of the estimated galaxy light. Right panel: the (host subtracted) SN spectrum is shown with and without correction for the wavelength dependent flux loss described by s (black/grey). The host galaxy contamination estimated from photometry (80%) agrees well with the fraction of host galaxy light indicated by the subtraction. The expected differential slit loss, see Sect. 5 (30% at 4000 Å) also seems compatible to what the best fit in the host-galaxy subtraction indicates (compare the curves at 4000 Å in the right panel).
Current usage metrics show cumulative count of Article Views (full-text article views including HTML views, PDF and ePub downloads, according to the available data) and Abstracts Views on Vision4Press platform.
Data correspond to usage on the plateform after 2015. The current usage metrics is available 48-96 hours after online publication and is updated daily on week days.
Initial download of the metrics may take a while.