Fig. 5
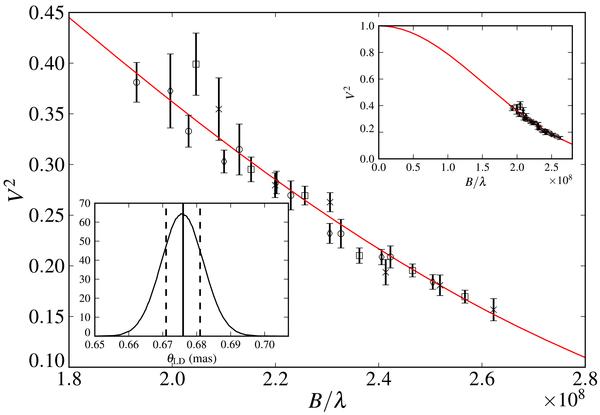
Calibrated squared visibilities for 18 Sco. The red line represents the best model. Each symbol type corresponds to one scan, the visibility averaged over five wavelength channels. Upper-right inset: same model represented on a larger scale. Lower-left inset: distribution for angular diameter (mean and standard deviation represented by vertical lines).
Current usage metrics show cumulative count of Article Views (full-text article views including HTML views, PDF and ePub downloads, according to the available data) and Abstracts Views on Vision4Press platform.
Data correspond to usage on the plateform after 2015. The current usage metrics is available 48-96 hours after online publication and is updated daily on week days.
Initial download of the metrics may take a while.