Fig. 3
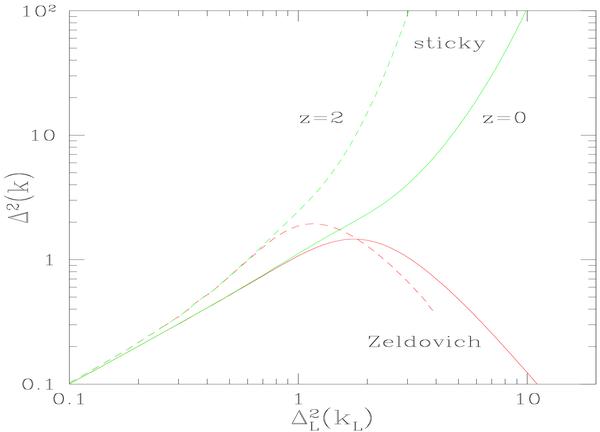
The nonlinear power per logarithmic interval of
wavenumber, Δ2(k), as a function of the linear
power  , at the Lagrangian
wavenumber kL defined by Eq. (47). The lower curves are obtained from
the Zeldovich power spectrum (13),
while the upper curves correspond to the power spectrum (41) of our “sticky model”. The solid
lines are for the redshift z = 0 and the dashed lines for
z = 2.
, at the Lagrangian
wavenumber kL defined by Eq. (47). The lower curves are obtained from
the Zeldovich power spectrum (13),
while the upper curves correspond to the power spectrum (41) of our “sticky model”. The solid
lines are for the redshift z = 0 and the dashed lines for
z = 2.
Current usage metrics show cumulative count of Article Views (full-text article views including HTML views, PDF and ePub downloads, according to the available data) and Abstracts Views on Vision4Press platform.
Data correspond to usage on the plateform after 2015. The current usage metrics is available 48-96 hours after online publication and is updated daily on week days.
Initial download of the metrics may take a while.