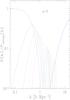
Fig. 2
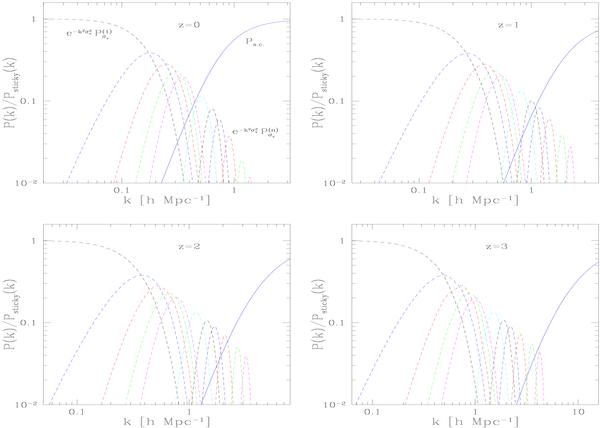
The dashed lines are the ratios of the “renormalized” perturbative terms of the
expansion (24) to the nonlinear
“sticky model” power spectrum,  , for n = 1
to 5 and
n = 10,15,20,30,50,
and 70. The solid line is the ratio of the nonperturbative correction to the
nonlinear power
spectrum, Ps.c.(k)/Psticky(k).
The four panels correspond to redshifts
z = 0,1,2, and 3 (with a shift
of the plot towards higher k at higher z).
, for n = 1
to 5 and
n = 10,15,20,30,50,
and 70. The solid line is the ratio of the nonperturbative correction to the
nonlinear power
spectrum, Ps.c.(k)/Psticky(k).
The four panels correspond to redshifts
z = 0,1,2, and 3 (with a shift
of the plot towards higher k at higher z).
Current usage metrics show cumulative count of Article Views (full-text article views including HTML views, PDF and ePub downloads, according to the available data) and Abstracts Views on Vision4Press platform.
Data correspond to usage on the plateform after 2015. The current usage metrics is available 48-96 hours after online publication and is updated daily on week days.
Initial download of the metrics may take a while.