Fig. 1
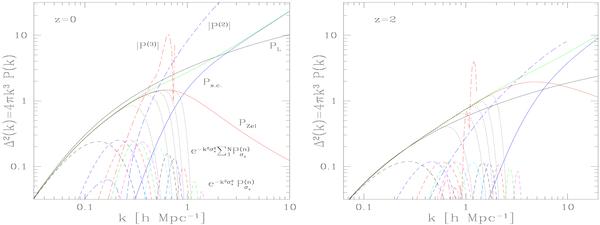
The power per logarithmic interval of k, as defined in Eq. (46), at redshifts z = 0
(left panel) and z = 2 (right
panel). The solid lines are the linear power
spectrum “PL”, the nonlinear Zeldovich power
spectrum “PZel”, given by Eq. (13), the nonperturbative
correction “Ps.c.”,
given by Eq. (45), and the
sum PZel + Ps.c.
associated with the “sticky model”, Eq. (41). The dot-dashed lines, which grow very fast and are only partly drawn,
are the absolute values of the standard perturbative
terms |P(2)|
and |P(3)| , from Eq. (23). The lower dashed lines are the
“renormalized” perturbative terms  of the expansion (24), from
Eq. (26), for
n = 1 to 5 and
n = 10,15,20,30,50,
and 70. The peak moves to higher k as the order n
increases. The dotted lines that follow the nonlinear Zeldovich power spectrum until
a Gaussian decay are the partial sums
of the expansion (24), from
Eq. (26), for
n = 1 to 5 and
n = 10,15,20,30,50,
and 70. The peak moves to higher k as the order n
increases. The dotted lines that follow the nonlinear Zeldovich power spectrum until
a Gaussian decay are the partial sums  , with
N = 5,10,15,20,
and 30. All terms are multiplied by the factor
4πk3 of Eq. (46).
, with
N = 5,10,15,20,
and 30. All terms are multiplied by the factor
4πk3 of Eq. (46).
Current usage metrics show cumulative count of Article Views (full-text article views including HTML views, PDF and ePub downloads, according to the available data) and Abstracts Views on Vision4Press platform.
Data correspond to usage on the plateform after 2015. The current usage metrics is available 48-96 hours after online publication and is updated daily on week days.
Initial download of the metrics may take a while.