Fig. 4
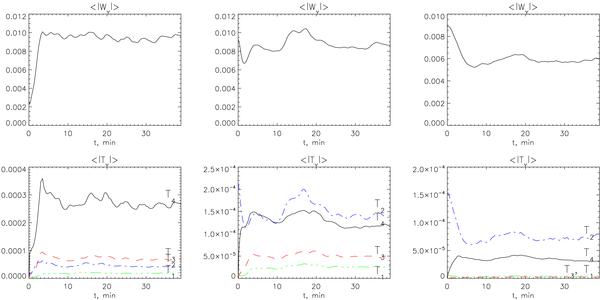
Dependence of ⟨ | ωy | ⟩ (top plots) and of different terms of the vorticity equation (bottom plots) on time at different heights in the domain. The first column corresponds to the upper photosphere (500 km above the approximate visible solar surface level), the second column is the visible surface level, and the third column corresponds to the convection zone (650 km below the visible surface level).
Current usage metrics show cumulative count of Article Views (full-text article views including HTML views, PDF and ePub downloads, according to the available data) and Abstracts Views on Vision4Press platform.
Data correspond to usage on the plateform after 2015. The current usage metrics is available 48-96 hours after online publication and is updated daily on week days.
Initial download of the metrics may take a while.