Fig. 4
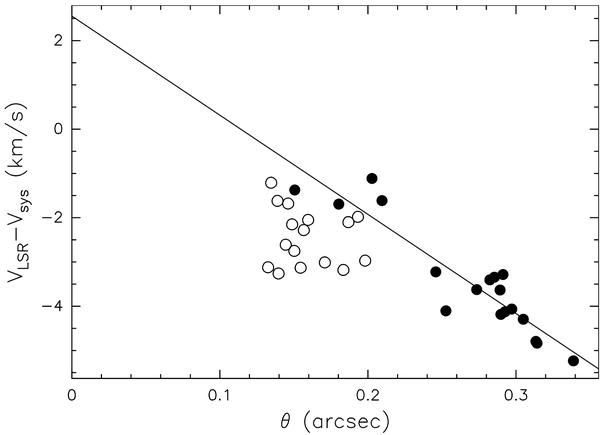
Plot of the line-of-sight velocity of the CH3OH maser features, relative to the systemic LSR velocity (–3.5 km s-1), versus the angular separation from the nominal position of the star, measured along the dashed line in Fig. 3. Solid and empty circles denote, respectively, group 1 and group 2 features. The line is a linear fit to the points of group 1.
Current usage metrics show cumulative count of Article Views (full-text article views including HTML views, PDF and ePub downloads, according to the available data) and Abstracts Views on Vision4Press platform.
Data correspond to usage on the plateform after 2015. The current usage metrics is available 48-96 hours after online publication and is updated daily on week days.
Initial download of the metrics may take a while.