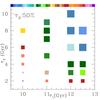
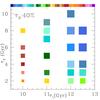
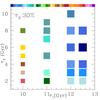
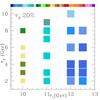
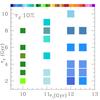
Fig. 9
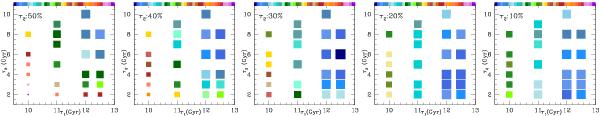
The χ2 diagnostic for the I-band LF fit for 2 burst simulations, built using alpha-enhanced stellar evolutionary models, as compared to observations is plotted as a function of the old (x-axis) + young (y-axis) population age. Each panel shows different relative fractions of old + young population in the combined 2-burst simulation. The size and colour of the points are normalized to the full range of the χ2 values of the LFI fit for all 2-burst models with input observed MDF. The larger the symbol, and darker blue its colour, the smaller the χ2.
Current usage metrics show cumulative count of Article Views (full-text article views including HTML views, PDF and ePub downloads, according to the available data) and Abstracts Views on Vision4Press platform.
Data correspond to usage on the plateform after 2015. The current usage metrics is available 48-96 hours after online publication and is updated daily on week days.
Initial download of the metrics may take a while.