Fig. 12
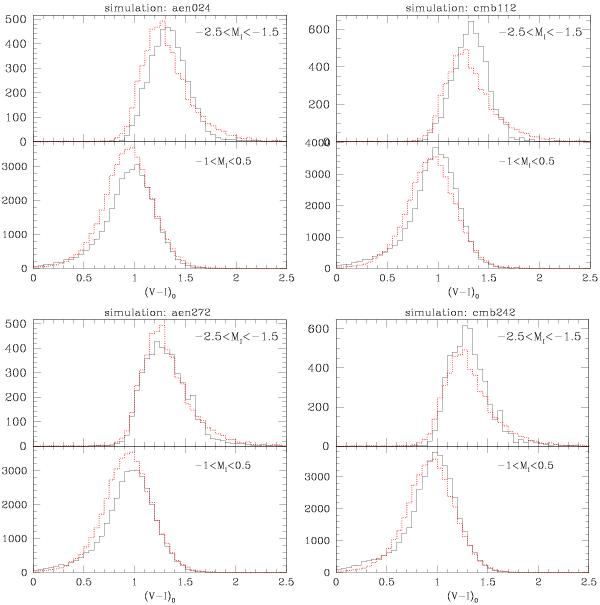
Comparison of V − I colour distributions between the data (dotted red line) and the simulations (solid black line), where only data in the specific luminosity range are considered. Upper panels show the colour distributions for the red giant branch stars that are selected in the magnitude range −2.5 < MI < −1.5 (where the bolometric corrections for the upper cool part of the RGB are not a problem), while the lower panels show the colour distributions for the part of the luminosity range dominated by helium burning stars (red clump) selected to be within range −1 < MI < + 0.5 mag. Upper left diagrams are for the best fitting single age simulation (11 Gyr old model) with input observed MDF. Upper right diagrams are for the best fitting two burst model which is made by combining single age simulations with input observed MDFs (80% 12 + 20% 3 Gyr). The bottom panels show the best fitting simulations with input closed box metallicity distributions – the single age closed box model on the left and the two-burst model composed of input closed box simulations is on the right.

Current usage metrics show cumulative count of Article Views (full-text article views including HTML views, PDF and ePub downloads, according to the available data) and Abstracts Views on Vision4Press platform.
Data correspond to usage on the plateform after 2015. The current usage metrics is available 48-96 hours after online publication and is updated daily on week days.
Initial download of the metrics may take a while.