Fig. 1
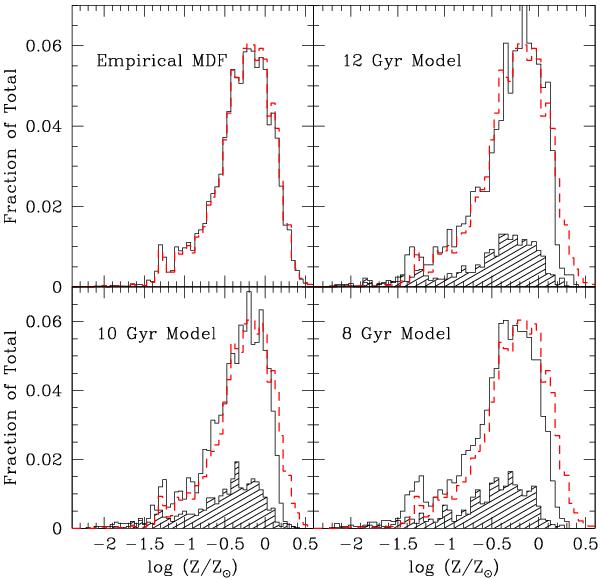
Upper left panel: differential metallicity distribution function (MDF), normalized by the total number of stars, derived from the observed CMD through the interpolation on the grid of Teramo alpha-enhanced isochrones is shown with solid (black) line. The observed MDF including the correction for the AGB bias is overplotted as dashed red histogram. The other three panels show the MDFs from single burst simulations, where simulations had in input the observed (upper left black histogram) MDF and single age bursts of 8, 10, and 12 Gyr. The shaded histograms show the contribution of AGB stars as a function of metallicity, while the open histograms show the contribution of only the RGB stars for each simulation. The MDFs of these simulated data are constructed in exactly the same way as for the observations, by interpolating over the isochrones in CMDs after the photometric errors were added to the simulated stars, and can therefore be compared directly with the observed AGB bias corrected MDF, which is overplotted with red dashed histogram.
Current usage metrics show cumulative count of Article Views (full-text article views including HTML views, PDF and ePub downloads, according to the available data) and Abstracts Views on Vision4Press platform.
Data correspond to usage on the plateform after 2015. The current usage metrics is available 48-96 hours after online publication and is updated daily on week days.
Initial download of the metrics may take a while.