Fig. 3
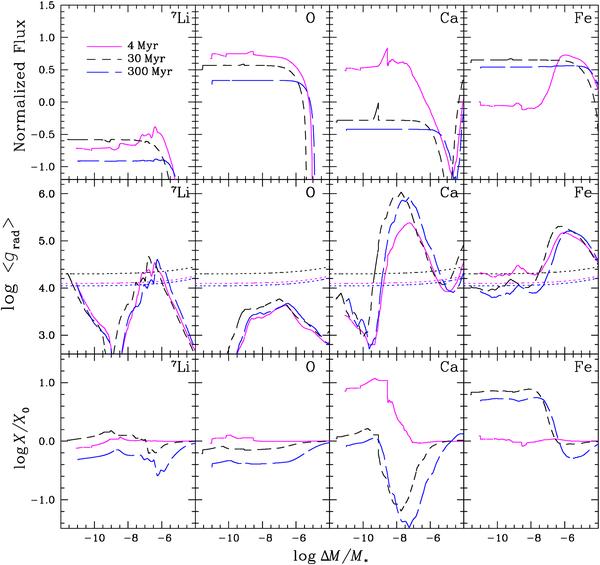
Comparison of the normalized local flux with radiative accelerations and internal abundances of 7Li, O, Ca and Fe at 3 different ages for the 2.50W5E-14 model. The curves end (on the left) at the bottom of the surface convection zone. In the middle row, the dotted line represents gravity.
Current usage metrics show cumulative count of Article Views (full-text article views including HTML views, PDF and ePub downloads, according to the available data) and Abstracts Views on Vision4Press platform.
Data correspond to usage on the plateform after 2015. The current usage metrics is available 48-96 hours after online publication and is updated daily on week days.
Initial download of the metrics may take a while.