Fig. 1
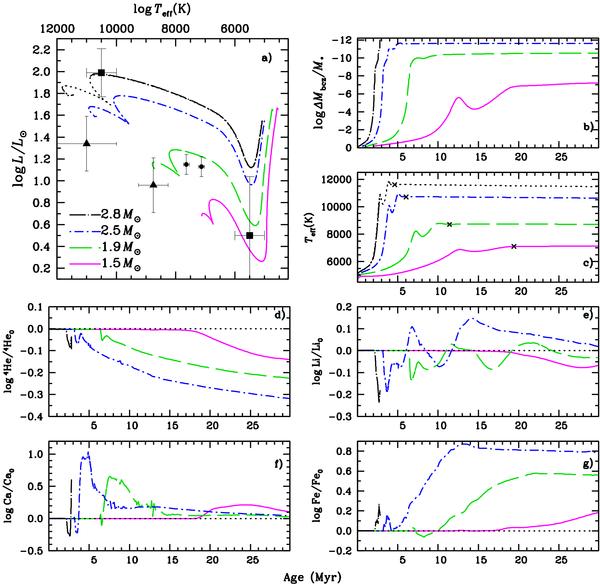
The position in the HR diagram a) is shown for four models with a mass loss rate of 5 × 10-14 M⊙ yr-1. The curves end (on the left) at 30 Myr, age at which all the models are on the main-sequence. The dotted segment of the 2.80 M⊙ curve represents a model with a mass loss rate of 10-13 M⊙ yr-1 and was added in a) and c) in order to facilitate extrapolation, though it was not added in other panels for which the mass loss rate has an effect. Observations are shown in the HR diagram for three sets of binary stars: (■) V380 Ori (Alecian et al. 2009); (▴) HD 72106 (Folsom et al. 2008); (•) RS Cha (Alecian et al. 2005). The evolution of the bottom of the surface convection zone b), Teff c), as well as the abundances of He d), 7Li e), Ca f) and Fe g) are also shown. In panel c), (×) marks the approximate end of the PMS.
Current usage metrics show cumulative count of Article Views (full-text article views including HTML views, PDF and ePub downloads, according to the available data) and Abstracts Views on Vision4Press platform.
Data correspond to usage on the plateform after 2015. The current usage metrics is available 48-96 hours after online publication and is updated daily on week days.
Initial download of the metrics may take a while.