Fig. 3
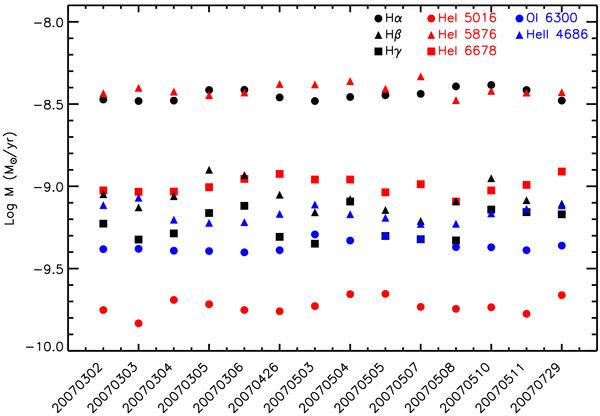
The variability of TW Hya. The different color/symbols represent different accretion-rate tracers (see upper right corner). Note the X-axis timescale is not linear. The variability in accretion rate is observed to be small in comparison to the range of accretion rates calculated from the different tracers.
Current usage metrics show cumulative count of Article Views (full-text article views including HTML views, PDF and ePub downloads, according to the available data) and Abstracts Views on Vision4Press platform.
Data correspond to usage on the plateform after 2015. The current usage metrics is available 48-96 hours after online publication and is updated daily on week days.
Initial download of the metrics may take a while.