Fig. 1
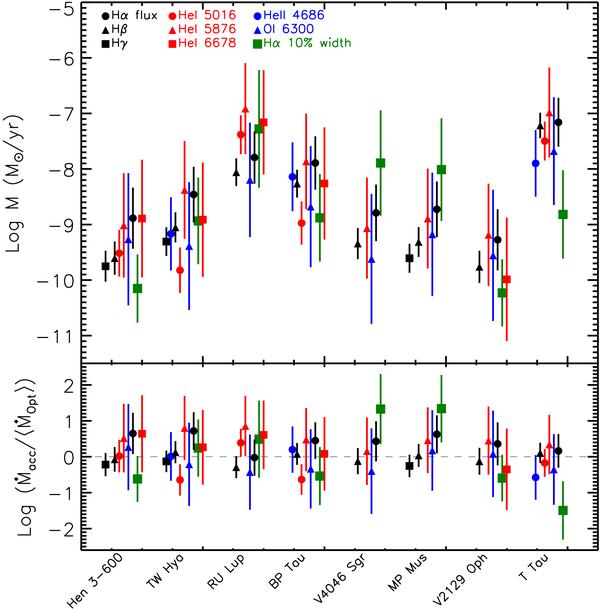
Top panel: plot of the different mass-accretion rates from different accretion tracer emission lines, for each of the stars in the sample. The stars are in order of increasing mass, showing no relation between mass and mass-accretion rate. Bottom panel: plot showing the ratio of each mass accretion rate estimate to the optical mean of the accretion rate for each star. The different symbols/colors represent different accretion rate tracers (see upper left corner in the top panel).
Current usage metrics show cumulative count of Article Views (full-text article views including HTML views, PDF and ePub downloads, according to the available data) and Abstracts Views on Vision4Press platform.
Data correspond to usage on the plateform after 2015. The current usage metrics is available 48-96 hours after online publication and is updated daily on week days.
Initial download of the metrics may take a while.