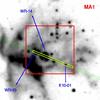
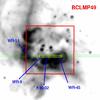
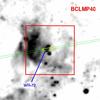
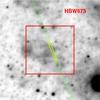
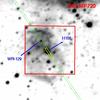
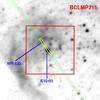
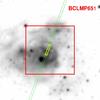
Fig. 3
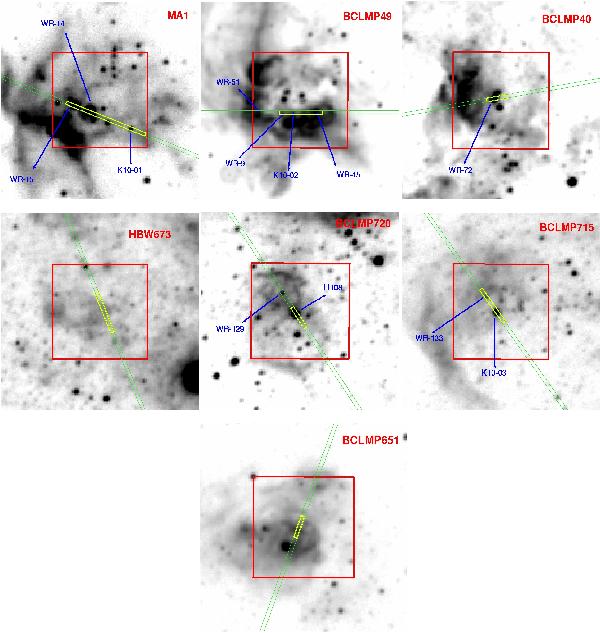
Slit position (green/light grey box) for all HII regions overplotted on the Hα image from the NOAO survey of resolved stellar content of local group galaxies (PI: P. Massey). Angular size is 40″ × 40″ (~160 × 160 pc2 at our assumed distance of 840 kpc). Yellow/light box marks where the nebular HeII emission is located within the slit. Blue arrows indicate the position and name of the associated hot stars. Red/dark grey box shows the size of the HeII images (20″ × 20″) as seen in Fig. 2. The spatial resolution and orientation are the same as in Fig. 1. The Hα image is shown in logarithmic scale to better enhance all the morphological features of the HII regions.
Current usage metrics show cumulative count of Article Views (full-text article views including HTML views, PDF and ePub downloads, according to the available data) and Abstracts Views on Vision4Press platform.
Data correspond to usage on the plateform after 2015. The current usage metrics is available 48-96 hours after online publication and is updated daily on week days.
Initial download of the metrics may take a while.