Fig. 9
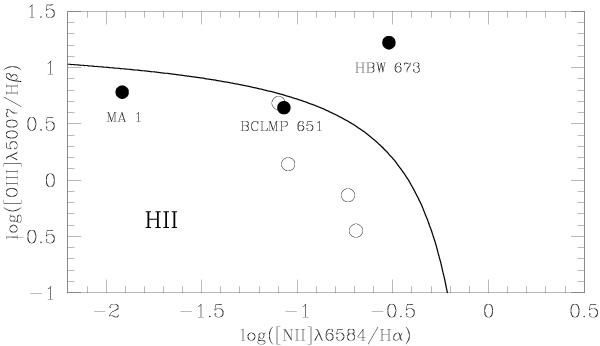
BPT diagnostic diagram for our sample of seven candidates for HeII-emitting HII regions. Full and empty circles represent the three confirmed HeII nebulae (MA 1, BCLMP 651, HBW 673) and the four remaining objects, respectively. The solid curve, from Kauffmann et al. (2003), indicates the empirical division between objects photoionized by stellar radiation (below the solid curve) and regions that are not dominated by stellar photoionization (above the solid curve).
Current usage metrics show cumulative count of Article Views (full-text article views including HTML views, PDF and ePub downloads, according to the available data) and Abstracts Views on Vision4Press platform.
Data correspond to usage on the plateform after 2015. The current usage metrics is available 48-96 hours after online publication and is updated daily on week days.
Initial download of the metrics may take a while.