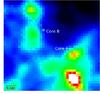
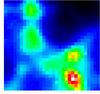
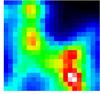
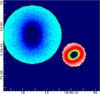
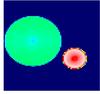
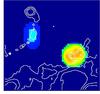
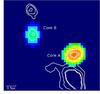
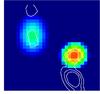
Fig. 3
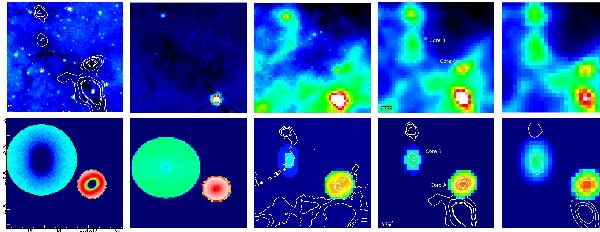
Upper row: observations of G031.03+00.76 taken at (left-right) Spitzer 8 μm (with 250 μm contours), PACS 70 and 160 μm and SPIRE 250, 350 and 500 μm. Lower row: model output for G031.03+00.76 at (left-right) 8 and 70 μm (example background only – showing core in absorption in middle) and 160, 250, 350 and 500 μm (in emission). Overlaid contours correspond to the observed data.
Current usage metrics show cumulative count of Article Views (full-text article views including HTML views, PDF and ePub downloads, according to the available data) and Abstracts Views on Vision4Press platform.
Data correspond to usage on the plateform after 2015. The current usage metrics is available 48-96 hours after online publication and is updated daily on week days.
Initial download of the metrics may take a while.