Free Access
Fig. 3
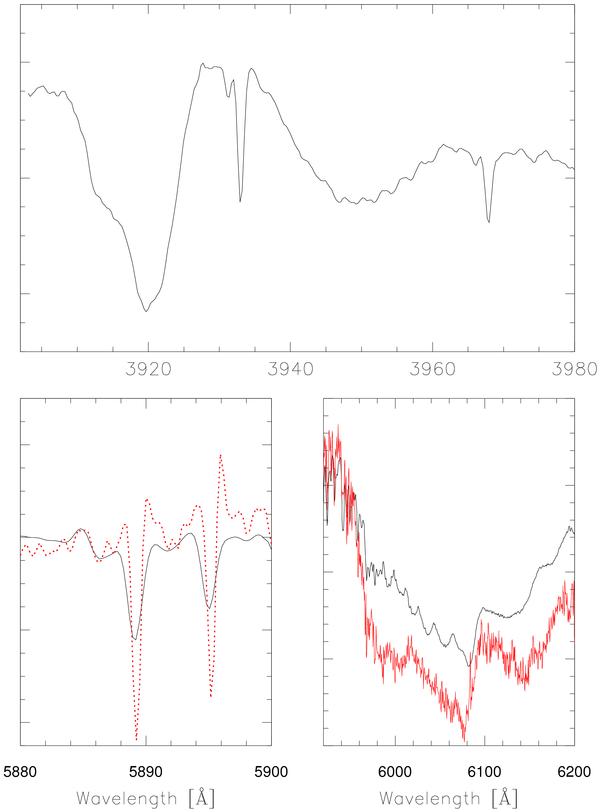
Close-ups of the CaII H&K line region (3920–3980 Å; top panel) and the region between the HeI 5876 Å and Na I D and the Hα region (5900–6200 Å; middle panel). Overplotted, are the relevant spectral regions of the 1999 spectrum from 4 for comparison, when available.
Current usage metrics show cumulative count of Article Views (full-text article views including HTML views, PDF and ePub downloads, according to the available data) and Abstracts Views on Vision4Press platform.
Data correspond to usage on the plateform after 2015. The current usage metrics is available 48-96 hours after online publication and is updated daily on week days.
Initial download of the metrics may take a while.