Fig. 9
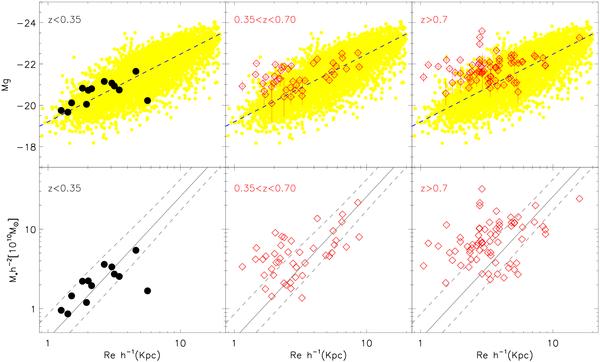
Luminosity-size relation in the g-band (up) and stellar mass-size relation (bottom) for our sample of early-type galaxies. The black points represent the galaxies with z < 0.35, and the open red diamonds are the objects with z > 0.35, divided in two redshift ranges. The small yellow points are the early-type galaxies from SDSS (Bernardi et al. 2003) and the dashed line is the linear fit to these data. The solid and dashed lines in the bottom panels represent the stellar masses of Shen et al. (2003) as a function of the local size distribution of early-type galaxies and its 1σ.
Current usage metrics show cumulative count of Article Views (full-text article views including HTML views, PDF and ePub downloads, according to the available data) and Abstracts Views on Vision4Press platform.
Data correspond to usage on the plateform after 2015. The current usage metrics is available 48-96 hours after online publication and is updated daily on week days.
Initial download of the metrics may take a while.