Fig. 8
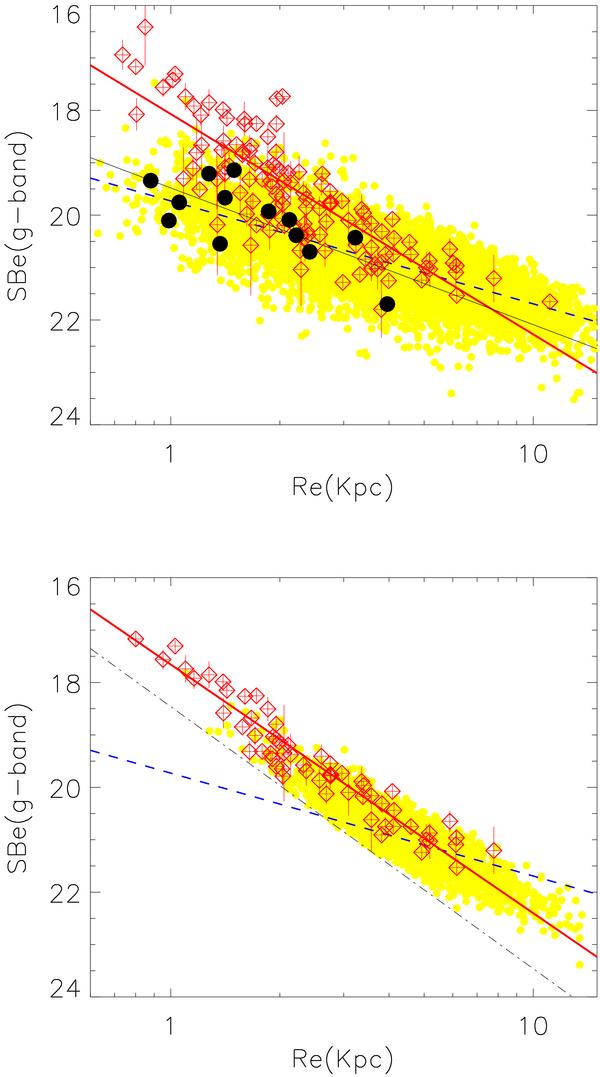
Upper panel: Kormendy relation in the g-band for the early-type galaxies in our sample. The black points represent the galaxies with z < 0.35, and the open red diamonds are the objects with z > 0.35. The small yellow points represent the early-type galaxies of SDSS (Bernardi et al. 2003), and the dashed blue line is the linear fit to this whole sample. The thin black line represents the weighted fit to our local sample, and the thick red line is the weighted fit to our high-redshift sample. In the bottom panel we present the same as for the upper panel, but limit our high-redshift sample and the SDSS one to the objects with absolute magnitudes in the range −21.5 > Mg > −22.5. The dot-dashed line correspond to Mg = −21.5.
Current usage metrics show cumulative count of Article Views (full-text article views including HTML views, PDF and ePub downloads, according to the available data) and Abstracts Views on Vision4Press platform.
Data correspond to usage on the plateform after 2015. The current usage metrics is available 48-96 hours after online publication and is updated daily on week days.
Initial download of the metrics may take a while.