Fig. 5
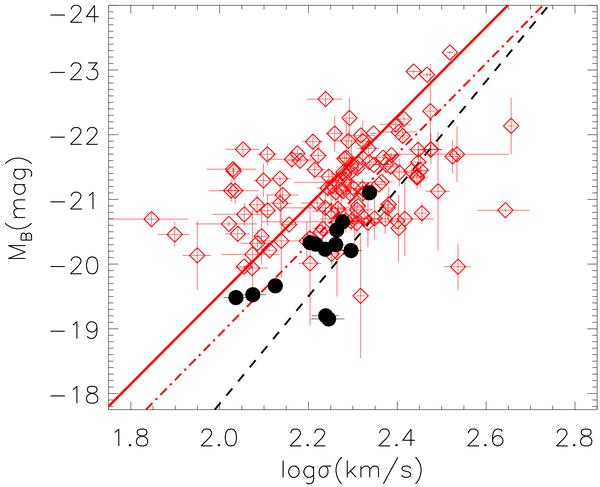
Faber-Jackson relation for the early-type galaxies in our sample. The black points represent the galaxies with z < 0.35, and the open red diamonds are the objects with z > 0.35. The dashed black line is the local relation used by Fritz et al. (2009a), and the dot-dashed red line is the fit to their distant sample (0.2 < z < 0.75). The solid red line is the weighted fit to our high-redshift sample.
Current usage metrics show cumulative count of Article Views (full-text article views including HTML views, PDF and ePub downloads, according to the available data) and Abstracts Views on Vision4Press platform.
Data correspond to usage on the plateform after 2015. The current usage metrics is available 48-96 hours after online publication and is updated daily on week days.
Initial download of the metrics may take a while.