Fig. 2
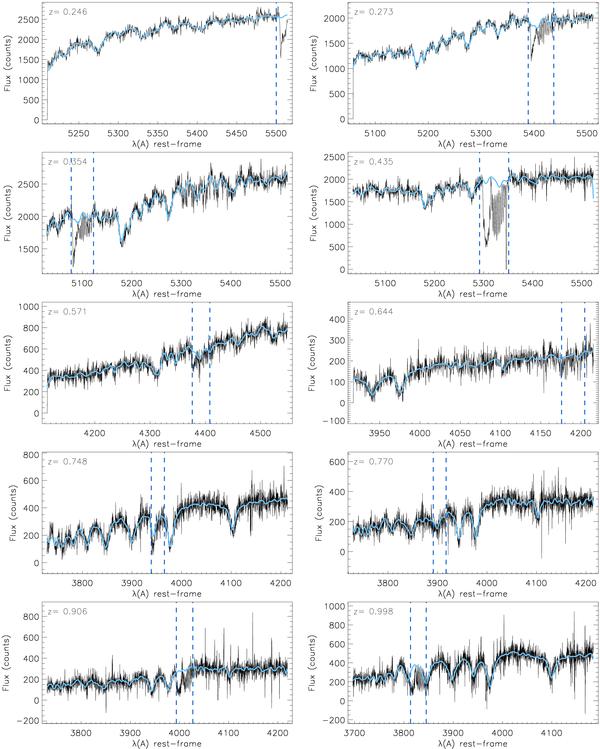
Example spectra (not flux-calibrated) of our sample of galaxies. The thin black line represents the rest-frame spectral data. The thick blue line is the galaxy model spectrum obtained from the convolution between the velocity profile and the stellar templates. The dashed vertical lines demarcate the regions that were excluded from the fitting because of the sky contamination by molecular bands.
Current usage metrics show cumulative count of Article Views (full-text article views including HTML views, PDF and ePub downloads, according to the available data) and Abstracts Views on Vision4Press platform.
Data correspond to usage on the plateform after 2015. The current usage metrics is available 48-96 hours after online publication and is updated daily on week days.
Initial download of the metrics may take a while.