Fig. 11
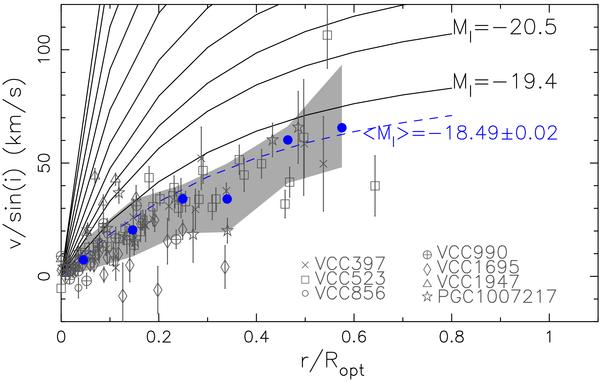
The observed rotation curves of rotationally supported dEs (grey symbols) compared to the mean rotation curves of late-type spiral galaxies (black solid and blue dashed lines) from Catinella et al. (2006). Blue filled dots represent the median observed rotation curve of rotationally supported dE in bins of r/Ropt = 0.1. The last bin contains all data for r/Ropt ≥ 0.5. The grey area indicates rotation velocities within 1σ from the median.
Current usage metrics show cumulative count of Article Views (full-text article views including HTML views, PDF and ePub downloads, according to the available data) and Abstracts Views on Vision4Press platform.
Data correspond to usage on the plateform after 2015. The current usage metrics is available 48-96 hours after online publication and is updated daily on week days.
Initial download of the metrics may take a while.