Fig. 2
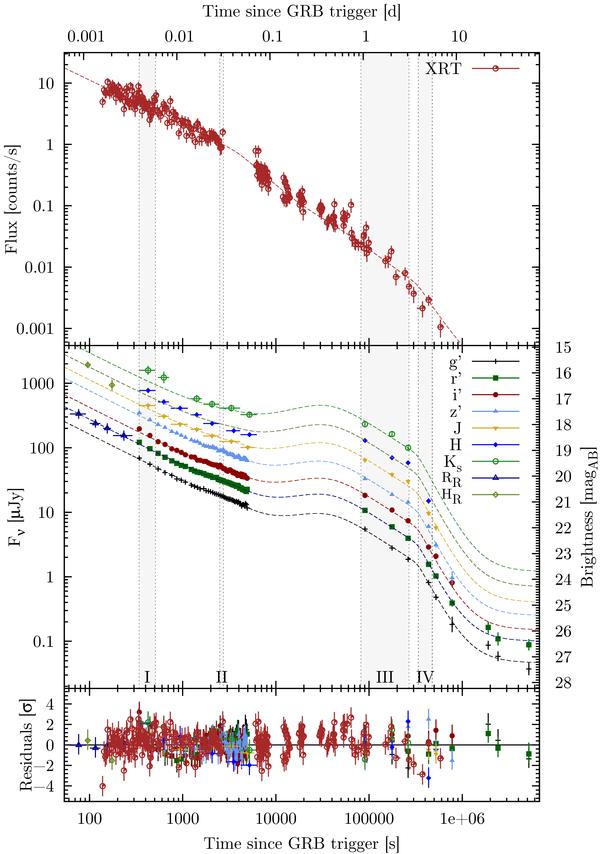
Light curve of the X-ray (top panel) and optical/NIR (middle panel) afterglow of GRB 080413B. Bands are offset by g′ + 2,r′ + 1.5,i′ + 1,z′ + 0.5,H − 0.5,Ks − 1 mag, and REM data RR and HR have offsets corresponding to GROND data. The bottom panel shows residuals to the combined light curve fit. Shown data are corrected for the Galactic foreground extinction and transformed into AB magnitudes. Upper limits are not shown for better clarity. Gray regions show the time intervals where SEDs are reported (Fig. 4).
Current usage metrics show cumulative count of Article Views (full-text article views including HTML views, PDF and ePub downloads, according to the available data) and Abstracts Views on Vision4Press platform.
Data correspond to usage on the plateform after 2015. The current usage metrics is available 48-96 hours after online publication and is updated daily on week days.
Initial download of the metrics may take a while.