Free Access
Fig. 7
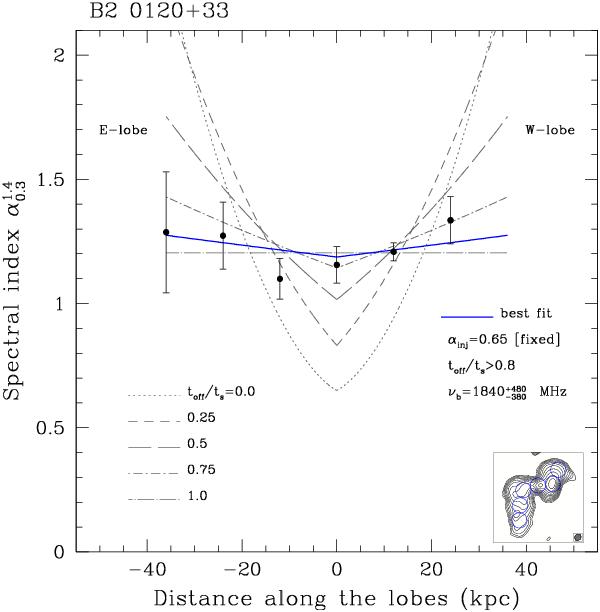
B2 0120+33 spectral index profile. Each point represents the average over a circular region as shown in the inset. The solid line is the best fit of the CIOFF model described in the text. The reference dashed lines correspond to different relative durations of the dying phase.
Current usage metrics show cumulative count of Article Views (full-text article views including HTML views, PDF and ePub downloads, according to the available data) and Abstracts Views on Vision4Press platform.
Data correspond to usage on the plateform after 2015. The current usage metrics is available 48-96 hours after online publication and is updated daily on week days.
Initial download of the metrics may take a while.