Fig. 2
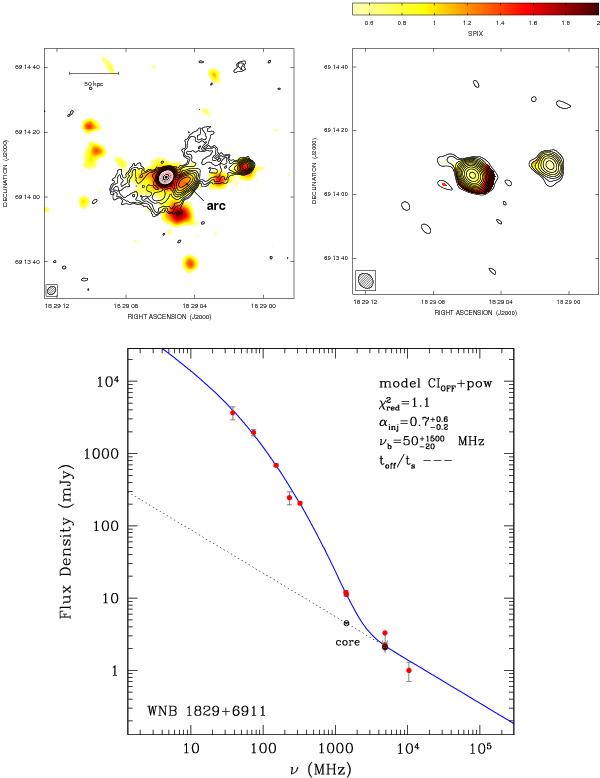
WNB 1829+6911. Top-left panel image has been taken at 1.4 GHz with the VLA in A+B+C configuration, the restoring beam FWHM is 2.9″ × 2.3″. The contours of the radio intensity are overlaid on the optical DSS2 image. The top-right panel show the overlay of the spectral index image between 1.4 and 4.8 GHz with the 4.8 GHz contour levels of the VLA C+D array image. The restoring beam FWHM is 5.2″ × 4.3″. Both the 1.4 and 4.8 GHz images have the same sensitivity level of 13 μJy/beam. Radio contours start from a level of 3σ-rms and scale by  . In the bottom panel, we show the integrated spectrum of the source along with the best-fit synchrotron model.
Current usage metrics show cumulative count of Article Views (full-text article views including HTML views, PDF and ePub downloads, according to the available data) and Abstracts Views on Vision4Press platform.
Data correspond to usage on the plateform after 2015. The current usage metrics is available 48-96 hours after online publication and is updated daily on week days.
Initial download of the metrics may take a while.