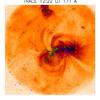
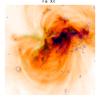
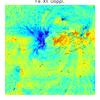
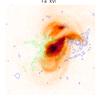
Fig. 7
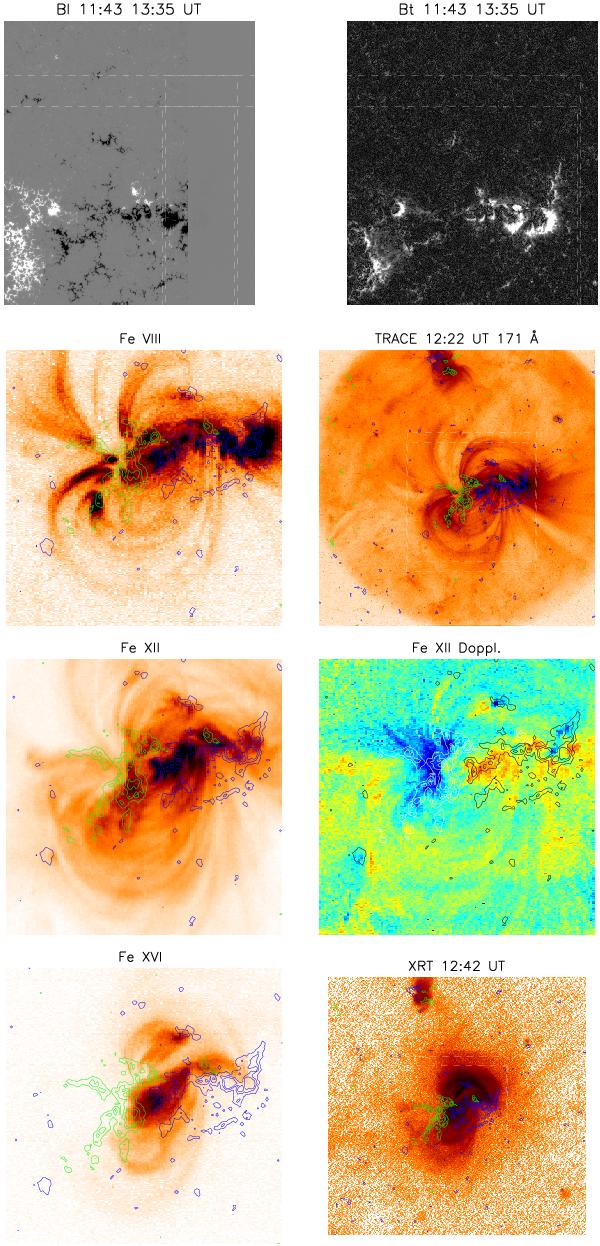
AR 10955 on 2007 May 12. Top to bottom: longitudinal (±800 Gauss) and transverse (±500 Gauss) apparent magnetic field from SOT/SP; “cool” emission as seen in EIS Fe VIII and TRACE 171 Å; 1 MK emission as seen in EIS Fe XII and associated Doppler-map (±20 km s-1); “hot” emission as seen in EIS Fe XVI and in XRT. The FOV of the EIS raster is shown as dashed box in the TRACE and XRT images. Contours superimposed on the images are LOS magnetic field densities from SOHO/MDI.
Current usage metrics show cumulative count of Article Views (full-text article views including HTML views, PDF and ePub downloads, according to the available data) and Abstracts Views on Vision4Press platform.
Data correspond to usage on the plateform after 2015. The current usage metrics is available 48-96 hours after online publication and is updated daily on week days.
Initial download of the metrics may take a while.