Fig. 6
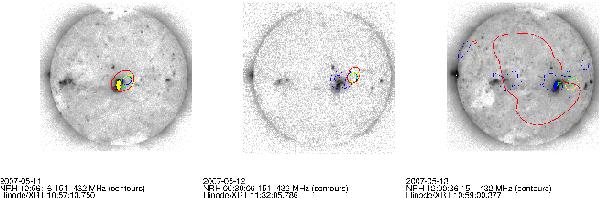
Hinode XRT (negative) images of AR 10955, superimposed with the brightest radio sources on 11 May 2007 (left; iso-intensity contours at 50% of the maximum, 1 min integration), May 12 (centre; iso-intensity contours at 80% maximum, 1 min integration) and May 13 (right; iso-intensity contours at 80% of the maximum, 5 min integration time). The radio emission comes from a noise storm at all frequencies on 11 May, from the same, decaying noise storm on 12 May, and from a newly emerging noise storm at frequencies down to 237 MHz on 13 May. The large red contour on 13 May shows quiet coronal emission. The noise storm did not extend to this low frequency at the time chosen for the plot. The colours show the same frequencies as in Fig. 2.
Current usage metrics show cumulative count of Article Views (full-text article views including HTML views, PDF and ePub downloads, according to the available data) and Abstracts Views on Vision4Press platform.
Data correspond to usage on the plateform after 2015. The current usage metrics is available 48-96 hours after online publication and is updated daily on week days.
Initial download of the metrics may take a while.