Free Access
Fig. 1
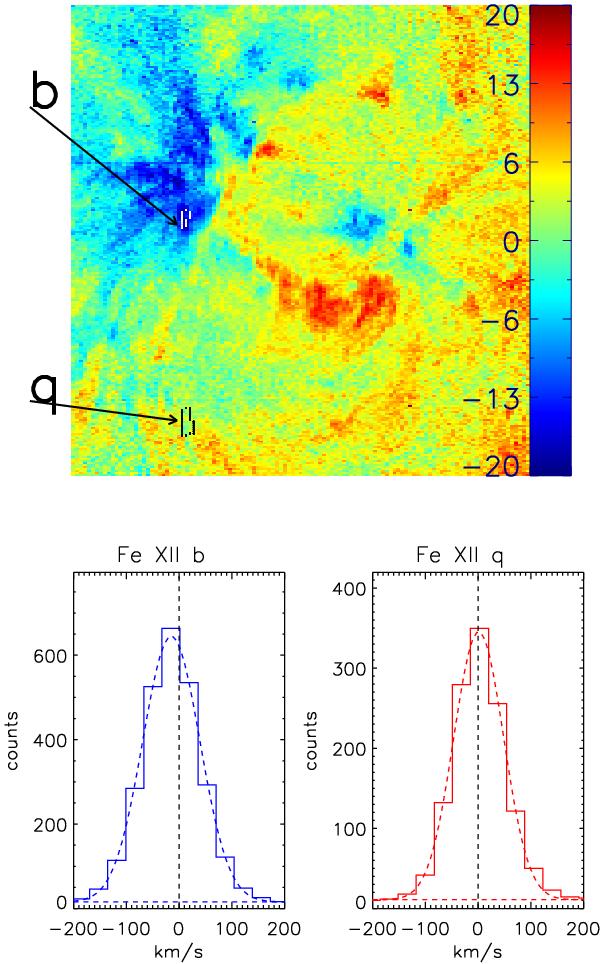
Above: Dopplermap in Fe xii 195.119 Å (±20 km s-1) of AR 10961 on 1 July 2007, with two selected regions, one within the coronal outflows (b), and one far from them (q). Below: Fe xii 195.119 Å line profiles in the selected regions, with superimposed Gaussian fitted profiles.
This figure is made of several images, please see below:
Current usage metrics show cumulative count of Article Views (full-text article views including HTML views, PDF and ePub downloads, according to the available data) and Abstracts Views on Vision4Press platform.
Data correspond to usage on the plateform after 2015. The current usage metrics is available 48-96 hours after online publication and is updated daily on week days.
Initial download of the metrics may take a while.