Fig. 5
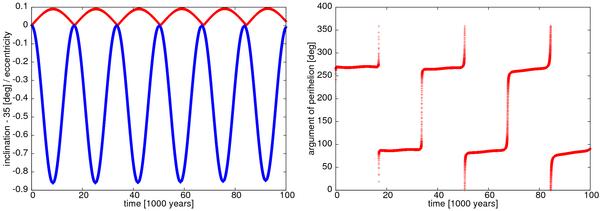
The left graph shows the eccentricity (red curve) and the inclination (blue curve – note that we substracted 35° from the inclination values for clearer visibility), while the right graph shows the argument of the pericenter evolutions of a typical test-planet orbit around 35°. The eccentricity of the gas giant is set to e1 = 0.5 and the semi-major axis of the test-planet to 0.15.
Current usage metrics show cumulative count of Article Views (full-text article views including HTML views, PDF and ePub downloads, according to the available data) and Abstracts Views on Vision4Press platform.
Data correspond to usage on the plateform after 2015. The current usage metrics is available 48-96 hours after online publication and is updated daily on week days.
Initial download of the metrics may take a while.