Fig. 1
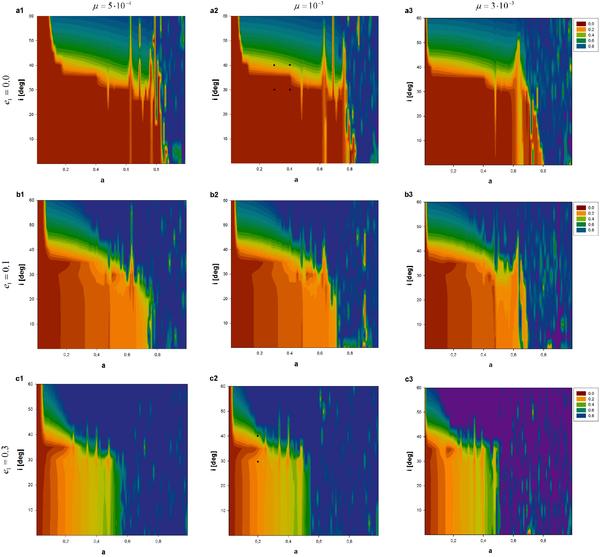
ME plots in the (a − i) plane. The color code corresponds to the maximum eccentricity – red means low eccentricity and therefore stable motion, green and blue correspond to high eccentricities and therefore unstable motion (see color code). The plots are for different mass ratios and eccentricities of the gas giant: first column: μ = 0.0005, e1 = 0,0.1,0.3 (up to down); second column: μ = 0.001, e1 = 0,0.1,0.3 (up to down); third column: μ = 0.003, e1 = 0,0.1,0.3 (up to down). The black dots indicate the orbits for which we also calculated LCI values (see Fig. 3).
Current usage metrics show cumulative count of Article Views (full-text article views including HTML views, PDF and ePub downloads, according to the available data) and Abstracts Views on Vision4Press platform.
Data correspond to usage on the plateform after 2015. The current usage metrics is available 48-96 hours after online publication and is updated daily on week days.
Initial download of the metrics may take a while.