Fig. 9
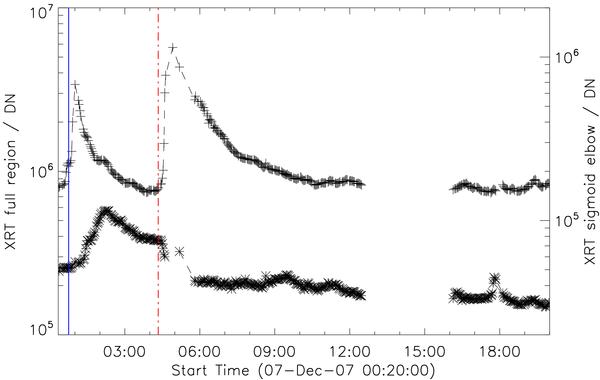
Light curves of the soft X-ray emission from the whole active region (crosses, top plot) and the northern elbow only (asterisks, bottom plot). The failed eruption beginning around 7 December 00:45 UT (blue solid line) produces a temporary enhancement in active region emission and is followed by an enhancement in the northern arm of the sigmoid. The main eruption (red dash-dot line) is accompanied by enhanced emission in the centre of the active region beginning at 7 December 04:20 UT and reduced emission in the northern elbow.
Current usage metrics show cumulative count of Article Views (full-text article views including HTML views, PDF and ePub downloads, according to the available data) and Abstracts Views on Vision4Press platform.
Data correspond to usage on the plateform after 2015. The current usage metrics is available 48-96 hours after online publication and is updated daily on week days.
Initial download of the metrics may take a while.