Fig. 4
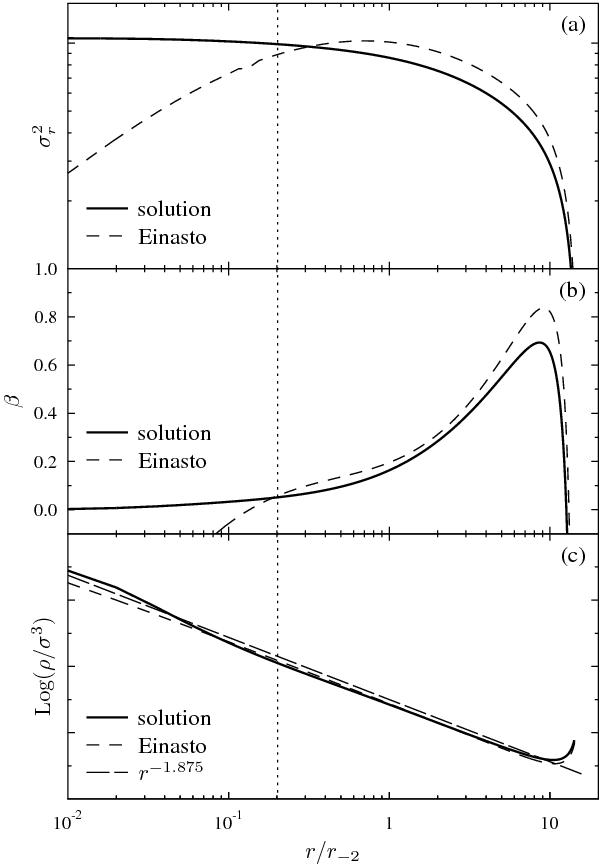
The radial velocity dispersion  , the anisotropy parameter
β(r), and the pseudo-phase-space density
Q(r) are shown in panels a),
b), c), respectively. The results based on the resulting
density profile in Sect. 3.3 are indicated as
“solution” in the figure. The results based on the Einasto profile are also shown
for comparison. The vertical scales of panels a) and c)
are arbitrary.
, the anisotropy parameter
β(r), and the pseudo-phase-space density
Q(r) are shown in panels a),
b), c), respectively. The results based on the resulting
density profile in Sect. 3.3 are indicated as
“solution” in the figure. The results based on the Einasto profile are also shown
for comparison. The vertical scales of panels a) and c)
are arbitrary.
Current usage metrics show cumulative count of Article Views (full-text article views including HTML views, PDF and ePub downloads, according to the available data) and Abstracts Views on Vision4Press platform.
Data correspond to usage on the plateform after 2015. The current usage metrics is available 48-96 hours after online publication and is updated daily on week days.
Initial download of the metrics may take a while.