Fig. 8
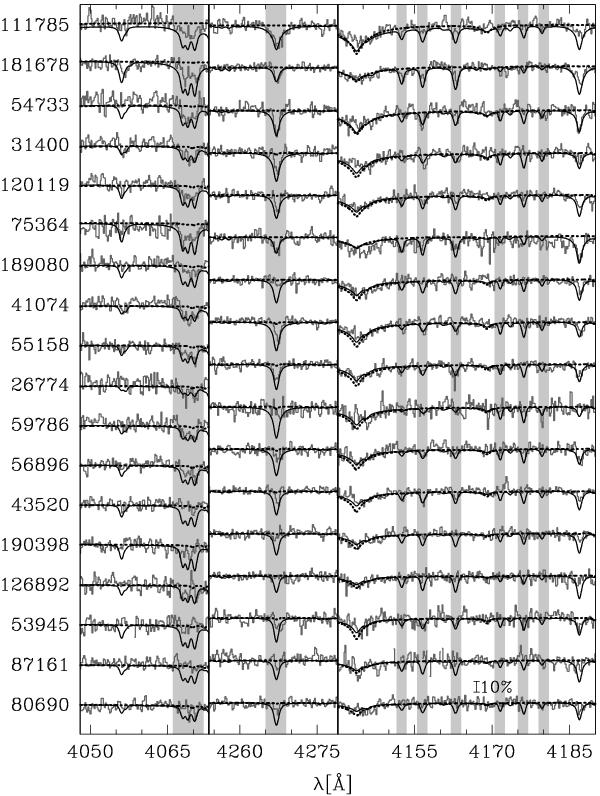
Spectra of all stars with super-solar helium abundances in spectral regions where strong carbon lines (marked with grey shading) are expected. The helium abundance decreases from top to bottom and the stars’ names are given. The black solid line marks the model spectrum with a carbon/nitrogen abundance of 3/1% by mass, while the dotted line (horizontal except for the He i line at 4144 Å) indicates the model spectrum with the cluster carbon and nitrogen abundances. We always plot the model spectra that best fit the observed helium and hydrogen lines.
Current usage metrics show cumulative count of Article Views (full-text article views including HTML views, PDF and ePub downloads, according to the available data) and Abstracts Views on Vision4Press platform.
Data correspond to usage on the plateform after 2015. The current usage metrics is available 48-96 hours after online publication and is updated daily on week days.
Initial download of the metrics may take a while.