Free Access
Fig. 18
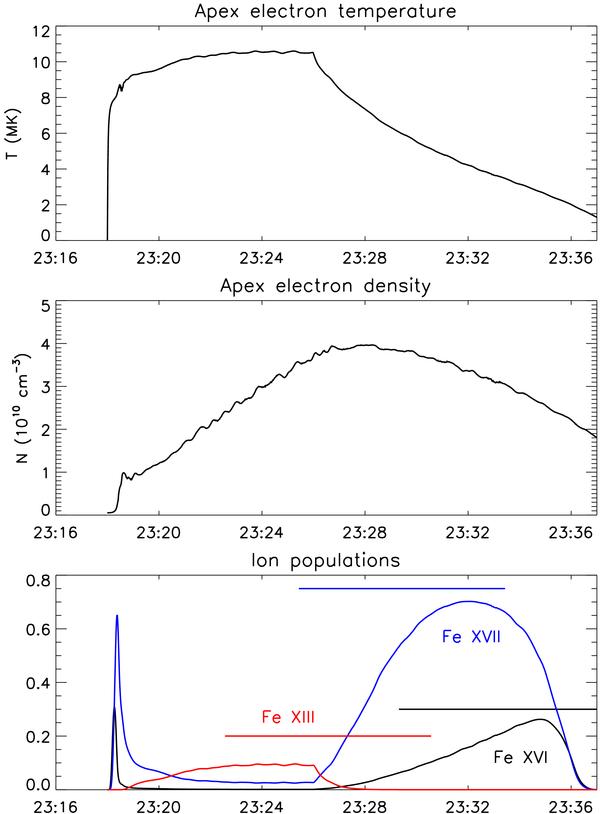
The theoretical variations of the apex electron temperature (top figure) and density (middle figure). The bottom figure shows the ion populations. The horizontal bars indicate the timings of peak emission as observed with 4-min cadence by Hinode EIS.
Current usage metrics show cumulative count of Article Views (full-text article views including HTML views, PDF and ePub downloads, according to the available data) and Abstracts Views on Vision4Press platform.
Data correspond to usage on the plateform after 2015. The current usage metrics is available 48-96 hours after online publication and is updated daily on week days.
Initial download of the metrics may take a while.