Fig. 15
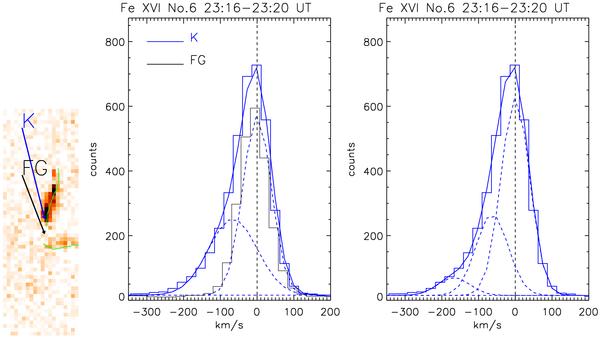
Left: image of the intensity of the blue-wing component in Fe xvi (recorded by EIS during the scan No. 6; the field of view is 40″ × 120″) with two selected regions, a foreground (FG) location in the core of the active region, and kernel (K) region just a few arcseconds north, in the northern ribbon. Middle: profiles of the Fe xvi 263 Å line, in the two regions. The dashed vertical line indicates the rest velocity, while the dashed lines are the Gaussian profiles of the main and secondary components of the spectrum in the kernel (K). Right: the same spectrum in the K region, fitted with three Gaussian components.
Current usage metrics show cumulative count of Article Views (full-text article views including HTML views, PDF and ePub downloads, according to the available data) and Abstracts Views on Vision4Press platform.
Data correspond to usage on the plateform after 2015. The current usage metrics is available 48-96 hours after online publication and is updated daily on week days.
Initial download of the metrics may take a while.