Fig. 10
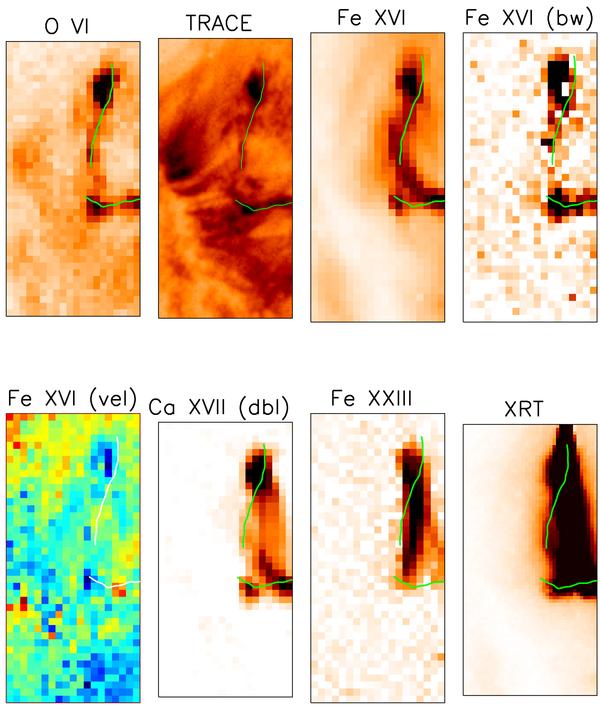
Results from the EIS raster No. 8, 23:24–23:28 UT. From the top left: intensity of O vi 184.1 Å; intensity of TRACE 171 Å; intensities of the main and blue-wing components of the Fe xvi 263 Å line; Doppler image of the centroid position of the main Fe xvi line; intensity in the Ca xvii, de-blended; intensity in Fe xxiii 263.7 Å; intensity in XRT (partly saturated). The TRACE 171 Å image was taken at 23:26:15 UT, while the XRT one at 23:24:38 UT. Superimposed is the location of the ribbons. Note that there is a slight offset in the vertical between the two EIS channels which has been accounted for. The field of view is 40″ × 80″.
Current usage metrics show cumulative count of Article Views (full-text article views including HTML views, PDF and ePub downloads, according to the available data) and Abstracts Views on Vision4Press platform.
Data correspond to usage on the plateform after 2015. The current usage metrics is available 48-96 hours after online publication and is updated daily on week days.
Initial download of the metrics may take a while.