Fig. 4
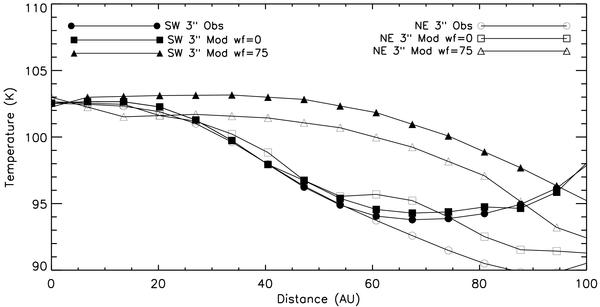
Color temperature profiles of the HR 4796A observations and models. Colors were calculated by summing the flux within a 3′′-wide swath along the long axis of the disk for each image. Model curves are shown for two different angles of pericenter, and we have concluded that a pericenter angle of zero provides the best fit.
Current usage metrics show cumulative count of Article Views (full-text article views including HTML views, PDF and ePub downloads, according to the available data) and Abstracts Views on Vision4Press platform.
Data correspond to usage on the plateform after 2015. The current usage metrics is available 48-96 hours after online publication and is updated daily on week days.
Initial download of the metrics may take a while.