Fig. 7
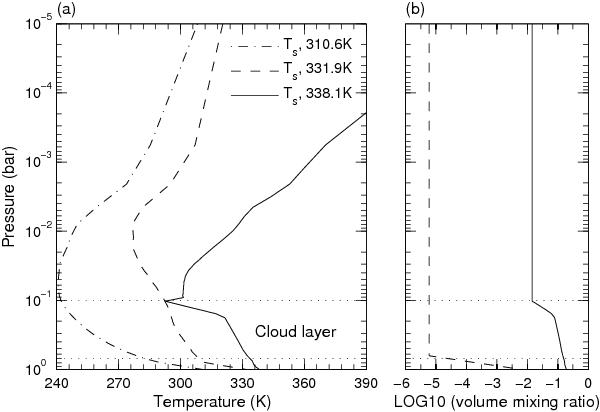
a) Simulated vertical temperature profiles for Gl 581c. Dash and dotted-line: dry atmosphere with Ps = 1 bar and 50 ppmv of CO2, Dashed-line: moist atmosphere with Ps = 1 bar, 50 ppmv of CO2, and same water-vapor mixing ratio as in the Earth atmosphere, and solid line: moist atmosphere with Ps = 1 bar, 50 ppmv CO2, fixed relative humidity same as in Manabe and Wetherald (1967). A cloud layer is located between 700 and 100 hPa marked by horizontal dotted-lines. b) Vertical profiles of water-vapor volume mixing ratio. The solid and dashed-lines in b) correspond to the solid and dashed-lines in a), respectively.
Current usage metrics show cumulative count of Article Views (full-text article views including HTML views, PDF and ePub downloads, according to the available data) and Abstracts Views on Vision4Press platform.
Data correspond to usage on the plateform after 2015. The current usage metrics is available 48-96 hours after online publication and is updated daily on week days.
Initial download of the metrics may take a while.